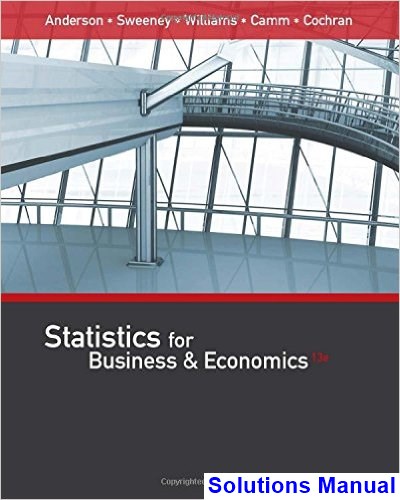
Instant download Statistics for Business and Economics 13th Edition Anderson Solutions Manual pdf docx epub after payment.

Product details:
- ISBN-10 : 1337094161
- ISBN-13 : 978-1337094160
- Author:
Get more out of your statistics course than simply solving equations. Discover how statistical information enables strong decisions in today’s business world with STATISTICS FOR BUSINESS AND ECONOMICS, REVISED 13E. Sound methodology combines with a proven problem-scenario approach, and meaningful applications for the most powerful approach to mastering critical business statistics. This edition’s prestigious author team brings together more than 25 years of unmatched experience to this thoroughly updated text. More than 350 real business examples, timely cases, and memorable exercises present the latest statistical data and business information with unwavering accuracy. To ensure the most relevant coverage, this edition includes coverage of popular commercial statistical software Minitab 17 and Excel 2016. Optional chapter appendices, coordinating data sets, and online learning tools, such as CengageNOW, create a customizable, efficient solution.
Table of contents:
- Chapter 1: Data and Statistics
- 1.1: Applications in Business and Economics
- 1.2: Data
- 1.3: Data Sources
- 1.4: Descriptive Statistics
- 1.5: Statistical Inference
- 1.6: Analytics
- 1.7: Big Data and Data Mining
- 1.8: Computers and Statistical Analysis
- 1.9: Ethical Guidelines for Statistical Practice
- 1: Supplementary Exercises (26)
- Chapter 2: Descriptive Statistics: Tabular and Graphical Displays
- 2.1: Summarizing Data for a Categorical Variable (10)
- 2.2: Summarizing Data for a Quantitative Variable (24)
- 2.3: Summarizing Data for Two Variables Using Tables (10)
- 2.4: Summarizing Data for Two Variables Using Graphical Displays (15)
- 2.5: Data Visualization: Best Practices in Creating Effective Graphical Displays
- 2: Supplementary Exercises (18)
- 2: Exploring Statistics Applet Exercises (2)
- 2: JMP Statistics Applet Exercises (9)
- Chapter 3: Descriptive Statistics: Numerical Measures
- 3.1: Measures of Location (25)
- 3.2: Measures of Variability (16)
- 3.3: Measures of Distribution Shape, Relative Location, and Detecting Outliers (13)
- 3.4: Five-Number Summaries and Boxplots (11)
- 3.5: Measures of Association Between Two Variables (9)
- 3.6: Data Dashboards: Adding Numerical Measures to Improve Effectiveness
- 3: Supplementary Exercises (18)
- 3: Exploring Statistics Applet Exercises (2)
- 3: JMP Statistics Applet Exercises (22)
- Chapter 4: Introduction to Probability
- 4.1: Random Experiments, Counting Rules, and Assigning Probabilities (14)
- 4.2: Events and Their Probabilities (7)
- 4.3: Some Basic Relationships of Probability (9)
- 4.4: Conditional Probability (7)
- 4.5: Bayes’ Theorem (7)
- 4: Supplementary Exercises (15)
- 4: Exploring Statistics Applet Exercises (2)
- Chapter 5: Discrete Probability Distributions
- 5.1: Random Variables (6)
- 5.2: Developing Discrete Probability Distributions (10)
- 5.3: Expected Value and Variance (12)
- 5.4: Bivariate Distributions, Covariance, and Financial Portfolios (7)
- 5.5: Binomial Probability Distribution (12)
- 5.6: Poisson Probability Distribution (7)
- 5.7: Hypergeometric Probability Distribution (6)
- 5: Supplementary Exercises (13)
- 5: Exploring Statistics Applet Exercises (1)
- Chapter 6: Continuous Probability Distributions
- 6.1: Uniform Probability Distribution (8)
- 6.2: Normal Probability Distribution (20)
- 6.3: Normal Approximation of Binomial Probabilities (6)
- 6.4: Exponential Probability Distribution (4)
- 6: Supplementary Exercises (12)
- 6: Exploring Statistics Applet Exercises (3)
- Chapter 7: Sampling and Sampling Distributions
- 7.1: The Electronics Associates Sampling Problem
- 7.2: Selecting a Sample (6)
- 7.3: Point Estimation (5)
- 7.4: Introduction to Sampling Distributions
- 7.5: Sampling Distribution of x̄ (11)
- 7.6: Sampling Distribution of p̄ (11)
- 7.7: Properties of Point Estimators
- 7.8: Other Sampling Methods
- 7: Supplementary Exercises (14)
- Chapter 8: Interval Estimation
- 8.1: Population Mean: σ Known (10)
- 8.2: Population Mean: σ Unknown (16)
- 8.3: Determining the Sample Size (8)
- 8.4: Population Proportion (13)
- 8: Supplementary Exercises (18)
- 8: Exploring Statistics Applet Exercises (9)
- 8: JMP Statistics Applet Exercises (10)
- Chapter 9: Hypothesis Tests
- 9.1: Developing Null and Alternative Hypotheses (4)
- 9.2: Type I and Type II Errors (4)
- 9.3: Population Mean: σ Known (14)
- 9.4: Population Mean: σ Unknown (15)
- 9.5: Population Proportion (13)
- 9.6: Hypothesis Testing and Decision Making
- 9.7: Calculating the Probability of Type II Errors (7)
- 9.8: Determining the Sample Size for a Hypothesis Test About a Population Mean (6)
- 9: Supplementary Exercises (11)
- 9: Exploring Statistics Applet Exercises (1)
- 9: JMP Statistics Applet Exercises (12)
- Chapter 10: Inference About Means and Proportions with Two Populations
- 10.1: Inferences About the Difference Between Two Population Means: σ1 and σ2 Known (10)
- 10.2: Inferences About the Difference Between Two Population Means: σ1 and σ2 Unknown (16)
- 10.3: Inferences About the Difference Between Two Population Means: Matched Samples (15)
- 10.4: Inferences About the Difference Between Two Population Proportions (9)
- 10: Supplementary Exercises (8)
- 10: Exploring Statistics Applet Exercises (2)
- 10: JMP Statistics Applet Exercises (24)
- Chapter 11: Inferences About Population Variances
- 11.1: Inferences About a Population Variance (16)
- 11.2: Inferences About Two Population Variances (14)
- 11: Supplementary Exercises (15)
- 11: Exploring Statistics Applet Exercises (2)
- Chapter 12: Comparing Multiple Proportions, Test of Independence and Goodness of Fit
- 12.1: Testing the Equality of Population Proportions for Three or More Populations (10)
- 12.2: Test of Independence (9)
- 12.3: Goodness of Fit Test (7)
- 12: Supplementary Exercises (9)
- 12: Exploring Statistics Applet Exercises (1)
- 12: JMP Statistics Applet Exercises (6)
- Chapter 13: Experimental Design and Analysis of Variance
- 13.1: An Introduction to Experimental Design and Analysis of Variance
- 13.2: Analysis of Variance and the Completely Randomized Design (18)
- 13.3: Multiple Comparison Procedures (10)
- 13.4: Randomized Block Design (12)
- 13.5: Factorial Experiment (8)
- 13: Supplementary Exercises (18)
- 13: Exploring Statistics Applet Exercises (2)
- 13: JMP Statistics Applet Exercises (6)
- Chapter 14: Simple Linear Regression
- 14.1: Simple Linear Regression Model
- 14.2: Least Squares Method (12)
- 14.3: Coefficient of Determination (9)
- 14.4: Model Assumptions
- 14.5: Testing for Significance (13)
- 14.6: Using the Estimated Regression Equation for Estimation and Prediction (9)
- 14.7: Computer Solution (8)
- 14.8: Residual Analysis: Validating Model Assumptions (7)
- 14.9: Residual Analysis: Outliers and Influential Observations (6)
- 14: Supplementary Exercises (7)
- 14: Exploring Statistics Applet Exercises (6)
- 14: JMP Statistics Applet Exercises (8)
- Chapter 15: Multiple Regression
- 15.1: Multiple Regression Model
- 15.2: Least Squares Method (11)
- 15.3: Multiple Coefficient of Determination (10)
- 15.4: Model Assumptions
- 15.5: Testing for Significance (8)
- 15.6: Using the Estimated Regression Equation for Estimation and Prediction (5)
- 15.7: Categorical Independent Variables (9)
- 15.8: Residual Analysis (6)
- 15.9: Logistic Regression (3)
- 15: Supplementary Exercises (6)
- Chapter 16: Regression Analysis: Model Building
- 16.1: General Linear Model (11)
- 16.2: Determining When to Add or Delete Variables (8)
- 16.3: Analysis of a Larger Problem
- 16.4: Variable Selection Procedures (2)
- 16.5: Multiple Regression Approach to Experimental Design (4)
- 16.6: Autocorrelation and the Durbin–Watson Test (2)
- 16: Supplementary Exercises (4)
- 16: Exploring Statistics Applet Exercises (1)
- Chapter 17: Time Series Analysis and Forecasting
- 17.1: Time Series Patterns
- 17.2: Forecast Accuracy (5)
- 17.3: Moving Averages and Exponential Smoothing (16)
- 17.4: Trend Projection (15)
- 17.5: Seasonality and Trend (12)
- 17.6: Time Series Decomposition (11)
- 17: Supplementary Exercises (17)
- 17: Exploring Statistics Applet Exercises (3)
- Chapter 18: Nonparametric Methods
- 18.1: Sign Test (12)
- 18.2: Wilcoxon Signed-Rank Test (9)
- 18.3: Mann–Whitney–Wilcoxon Test (14)
- 18.4: Kruskal–Wallis Test (9)
- 18.5: Rank Correlation (10)
- 18: Supplementary Exercises (16)
- Chapter 19: Statistical Methods for Quality Control
- 19.1: Philosophies and Frameworks
- 19.2: Statistical Process Control (7)
- 19.3: Acceptance Sampling (4)
- 19: Supplementary Exercises (6)
- 19: Exploring Statistics Applet Exercises (2)
- Chapter 20: Index Numbers
- 20.1: Price Relatives
- 20.2: Aggregate Price Indexes (4)
- 20.3: Computing an Aggregate Price Index from Price Relatives (3)
- 20.4: Some Important Price Indexes
- 20.5: Deflating a Series by Price Indexes (4)
- 20.6: Price Indexes: Other Considerations
- 20.7: Quantity Indexes (2)
- 20: Supplementary Exercises (5)
- Chapter 21: Decision Analysis (On Website)
- 21.1: Problem Formulation
- 21.2: Decision Making with Probabilities
- 21.3: Decision Analysis with Sample Information
- 21.4: Computing Branch Probabilities Using Bayes’ Theorem
- 21: Supplementary Exercises
- Chapter 22: Sample Survey (On Website)
- 22.1: Terminology Used in Sample Surveys
- 22.2: Types of Surveys and Sampling Methods
- 22.3: Survey Errors
- 22.4: Simple Random Sampling
- 22.5: Stratified Simple Random Sampling
- 22.6: Cluster Sampling
- 22.7: Systematic Sampling
- 22: Supplementary Exercises
People also search:
Statistics for Business and Economics 13th Edition Anderson
Statistics for Business and Economics 13th Edition Anderson pdf
Statistics for Business and Economics
what is statistics for business and economics
applied statistics for business and economics
statistics for economics accounting and business studies


