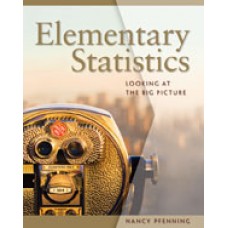
This is completed downloadable of Solution Manual for Elementary Statistics Looking at the Big Picture, 1st Edition

Product Details:
- ISBN-10 : 0495016527
- ISBN-13 : 978-0495016526
- Author:
Using a successfully class-tested approach that gives coherence to a broad range of introductory topics, this innovative text provides students with a big picture view of statistics as well as problem-solving strategies that can be applied in many statistical problems. Author Nancy Pfenning organizes content around four basic processes of statistics: producing data, displaying and summarizing data, understanding probability, and performing statistical inference. Within this framework, the book progresses systematically through five basic problem situations involving values of variables (quantitative, categorical, or a blend). As a result, students learn to identify which situation applies to a specific problem and how to choose the correct display, summary, or inference tool. As students gain proficiency in specific statistical techniques, the author also points out connections among topics and techniques to help them gain a perspective on statistics as a whole. More than 1,000 real-life examples and categorized exercises support the approach, engaging students in practicing and developing a variety of skills.
Table of Content:
1. Introduction: Variables and Processes in Statistics. Types of Variables: Categorical or Quantitative. Students Talk Stats: Identifying Types of Variables. Handling. Data for Two Types of Variables. Roles of Variables: Explanatory or Response. Statistics as a Four-Stage Process. PART I: DATA PRODUCTION. 2. Sampling: Which Individuals Are Studied. Sources of Bias in Sampling: When Selected Individuals Are Not Representative. Probability Sampling Plans: Relying on Randomness. Role of Sample Size: Bigger Is Better if the Sample Is Representative. From Sample to Population: To What Extent Can We Generalize? Students Talk Stats: Seeking a Representative Sample. 3. Design: How Individuals Are Studied. Various Designs for Studying Variables. Sample Surveys: When Individuals Report Their Own Values. Observational Studies: When Nature Takes Its Course. Experiments: When Researchers Take Control. Students Talk Stats: Does TV Cause ADHD? Considering Study Design. PART II: DISPLAYING AND SUMMARIZING DATA. 4. Displaying and Summarizing Data for a Single Variable. Single Categorical Variable. Students Talk Stats: Biased Sample, Biased Assessment. Single Quantitative Variables and the Shape of a Distribution. Center and Spread: What’s Typical for Quantitative Values, and How They Vary. Normal Distributions: The Shape of Things to Come. 5. Displaying and Summarizing Relationships. Relationship Between One Categorical and One Quantitative Variable. Students Talk Stats: Displaying and Summarizing Paired Data. Relationship Between Two Categorical Variables. Relationships Between Two Quantitative Variables. Students Talk Stats: How Outliers and Influential Observations Affect a Relationship. Students Talk Stats: Confounding in a Relationship Between Two Quantitative Variables. PART III: PROBABILITY. 6. Finding Probabilities. The Meaning of “Probability” and Basic Rules. More General Probability Rules and Conditional Probability. Students Talk Stats: Probability as a Weighted Average of Conditional Probabilities. 7. Random Variables. Discrete Random Variables. Binomial Random Variables. Students Talk Stats: Calculating and Interpreting the Mean and Standard Deviation of Count or Proportion. Continuous Random Variables and the Normal Distribution. Students Talk Stats: Means, Standard Deviations, and Below-Average Heights. 8. Sampling Distributions. The Behavior of Sample Proportion in Repeated Random Samples. The Behavior of Sample Mean in Repeated Random Samples. Students Talk Stats: When Normal Approximations Are Appropriate. PART IV: STATISTICAL INFERENCE. 9. Inference for a Single Categorical Variable. Point Estimate and Confidence Interval: A Best Guess and a Range of Plausible Values for Population Proportion. Students Talk Stats: Interpreting a Confidence Interval. Test: Is a Proposed Population Proportion Plausible? Students Talk Stats: Interpreting a P-value. Students Talk Stats: What Type of Error Was Made? Students Talk Stats: The Correct Interpretation of a Small P-value. Students Talk Stats: The Correct Interpretation When a P-value Is Not Small. 10. Inference for a Single Quantitative Variable. Inference for a Mean when Population Standard Deviation Is Known or Sample Size Is Large. Students Talk Stats: Confidence Interval for a Mean. Students Talk Stats: Interpreting a Confidence Interval for the Mean Correctly. Inference for a Mean When the Population Standard Deviation Is Unknown and the Sample Size Is Small. Students Talk Stats: Practical Application of a t Test. A Closer Look at Inference for Means. 11. Inference for Relationships Between Categorical and Quantitative Variables. Inference for a Paired Design with t. Inference for a Two-Sample Design with t. Students Talk Stats: Ordinary Vs. Pooled Two-Sample t. Inference for a Several-sample Design with F: Analysis of Variance. Students Talk Stats: Reviewing Relationships between Categorical and Quantitative Variables. 12. Inference for Relationships Between Two Categorical Variables. Comparing Proportions with a z Test. Comparing Counts with a Chi-Square Test. 13. Inference for Relationships Between Two Quantitative Variables. Inference for Regression: Focus on the Slope of the Regression Line. Students Talk Stats: No Evidence of a Relationship. Interval Estimates for an Individual or Mean Response. 14. How Statistics Problems Fit into the Big Picture. The Big Picture in Problem-Solving. Students Talk Stats: Choosing the Appropriate Statistical Tools. 15. Non-Parametric Methods (Online). The Sign Test as an Alternative to the Paired t Test. The Rank-Sum Test as an Alternative to the Two-Sample t Test. Summary of Non-Parametrics. 16. Two-Way ANOVA (Online). 17. Multiple Regression (Online). PART V: SOLUTIONS TO SELECTED EXERCISES.
People Also Search:
elementary statistics looking at the big picture 1st edition
elementary statistics looking at the big picture
elementary statistics looking at the big picture 1st edition download scribd
elementary statistics looking at the big picture 1st edition solution manual download pdf


