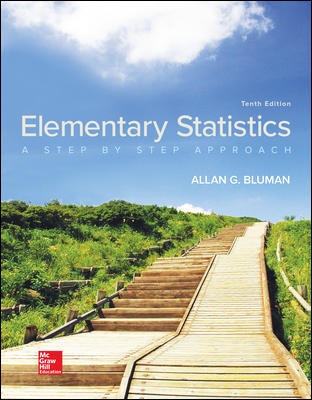
This is completed downloadable of Test Bank for Elementary Statistics: A Step By Step Approach, 10th Edition, Allan Bluman

Product Details:
- ISBN-10 : 1259755339
- ISBN-13 : 978-1259755330
- Author: Allan Bluman
Al Bluman’s Elementary Statistics takes a non-theoretical approach to teaching the course. Statistics is the language of today’s world and Bluman’s market-leading Step-by-Step Approach makes it easy to learn and understand! Helping students move from the computational to the conceptual, Bluman provides all the support your students need to grasp the fundamentals of statistics and make that connection.
Table of Content:
- CHAPTER 1: The Nature of Probability and Statistics
- Introduction
- 1–1 Descriptive and Inferential Statistics
- 1–2 Variables and Types of Data
- 1–3 Data Collection and Sampling Techniques
- Random Sampling
- Systematic Sampling
- Stratified Sampling
- Cluster Sampling
- Other Sampling Methods
- 1–4 Experimental Design
- Observational and Experimental Studies
- Uses and Misuses of Statistics
- 1–5 Computers and Calculators
- Summary
- CHAPTER 2 Frequency Distributions and Graphs
- Introduction
- 2–1 Organizing Data
- Categorical Frequency Distributions
- Grouped Frequency Distributions
- 2–2 Histograms, Frequency Polygons, and Ogives
- The Histogram
- The Frequency Polygon
- The Ogive
- Relative Frequency Graphs
- Distribution Shapes
- 2–3 Other Types of Graphs
- Bar Graphs
- Pareto Charts
- The Time Series Graph
- The Pie Graph
- Dotplots
- Stem and Leaf Plots
- Misleading Graphs
- Summary
- CHAPTER 3 Data Description
- Introduction
- 3–1 Measures of Central Tendency
- The Mean
- The Median
- The Mode
- The Midrange
- The Weighted Mean
- Distribution Shapes
- 3–2 Measures of Variation
- Range
- Population Variance and Standard Deviation
- Sample Variance and Standard Deviation
- Variance and Standard Deviation for Grouped Data
- Coefficient of Variation
- Range Rule of Thumb
- Chebyshev’s Theorem
- The Empirical (Normal) Rule
- Linear Transformation of Data
- 3–3 Measures of Position
- Standard Scores
- Percentiles
- Quartiles and Deciles
- Outliers
- 3–4 Exploratory Data Analysis
- The Five-Number Summary and Boxplots
- Summary
- CHAPTER 4 Probability and Counting Rules
- Introduction
- 4–1 Sample Spaces and Probability
- Basic Concepts
- Classical Probability
- Complementary Events
- Empirical Probability
- Law of Large Numbers
- Subjective Probability
- Probability and Risk Taking
- 4–2 The Addition Rules for Probability
- 4–3 The Multiplication Rules and Conditional Probability
- The Multiplication Rules
- Conditional Probability
- Probabilities for “At Least”
- 4–4 Counting Rules
- The Fundamental Counting Rule
- Factorial Notation
- Permutations
- Combinations
- 4–5 Probability and Counting Rules
- Summary
- CHAPTER 5 Discrete Probability Distributions
- Introduction
- 5–1 Probability Distributions
- 5–2 Mean, Variance, Standard Deviation, and Expectation
- Mean
- Variance and Standard Deviation
- Expectation
- 5–3 The Binomial Distribution
- 5–4 Other Types of Distributions
- The Multinomial Distribution
- The Poisson Distribution
- The Hypergeometric Distribution
- The Geometric Distribution
- Summary
- CHAPTER 6 The Normal Distribution
- Introduction
- 6–1 Normal Distributions
- The Standard Normal Distribution
- Finding Areas Under the Standard Normal Distribution Curve
- A Normal Distribution Curve as a Probability Distribution Curve
- 6–2 Applications of the Normal Distribution
- Finding Data Values Given Specific Probabilities
- Determining Normality
- 6–3 The Central Limit Theorem
- Distribution of Sample Means
- Finite Population Correction Factor (Optional)
- 6–4 The Normal Approximation to the Binomial Distribution
- Summary
- CHAPTER 7 Confidence Intervals and Sample Size
- Introduction
- 7–1 Confidence Intervals for the Mean When σ Is Known
- Confidence Intervals
- Sample Size
- 7–2 Confidence Intervals for the Mean When σ Is Unknown
- 7–3 Confidence Intervals and Sample Size for Proportions
- Confidence Intervals
- Sample Size for Proportions
- 7–4 Confidence Intervals for Variances and Standard Deviations
- Summary
- CHAPTER 8 Hypothesis Testing
- Introduction
- 8–1 Steps in Hypothesis Testing—Traditional Method
- 8–2 z Test for a Mean
- P-Value Method for Hypothesis Testing
- 8–3 t Test for a Mean
- 8–4 z Test for a Proportion
- 8–5 χ2 Test for a Variance or Standard Deviation
- 8–6 Additional Topics Regarding Hypothesis Testing
- Confidence Intervals and Hypothesis Testing
- Type II Error and the Power of a Test
- Summary
- CHAPTER 9: Testing the Difference Between Two Means, Two Proportions, and Two Variances
- Introduction
- 9–1 Testing the Difference Between Two Means: Using the z Test
- 9–2 Testing the Difference Between Two Means of Independent Samples: Using the t Test
- 9–3 Testing the Difference Between Two Means: Dependent Samples
- 9–4 Testing the Difference Between Proportions
- 9–5 Testing the Difference Between Two Variances
- Summary
- CHAPTER 10: Correlation and Regression
- Introduction
- 10–1 Scatter Plots and Correlation
- Correlation
- 10–2 Regression
- Line of Best Fit
- Determination of the Regression Line Equation
- 10–3 Coefficient of Determination and Standard Error of the Estimate
- Types of Variation for the Regression Model
- Residual Plots
- Coefficient of Determination
- Standard Error of the Estimate
- Prediction Interval
- 10–4 Multiple Regression (Optional)
- The Multiple Regression Equation
- Testing the Significance of R
- Adjusted R2
- Summary
- CHAPTER 11: Other Chi-Square Tests
- Introduction
- 11–1 Test for Goodness of Fit
- Test of Normality (Optional)
- 11–2 Tests Using Contingency Tables
- Test for Independence
- Test for Homogeneity of Proportions
- Summary
- CHAPTER: 12 Analysis of Variance
- Introduction
- 12–1 One-Way Analysis of Variance
- 12–2 The Scheffé Test and the Tukey Test
- Scheffé Test
- Tukey Test
- 12–3 Two-Way Analysis of Variance
- Summary
- CHAPTER 13: Nonparametric Statistics
- Introduction
- 13–1 Advantages and Disadvantages of Nonparametric Methods
- Advantages
- Disadvantages
- Ranking
- 13–2 The Sign Test
- Single-Sample Sign Test
- Paired-Sample Sign Test
- 13–3 The Wilcoxon Rank Sum Test
- 13–4 The Wilcoxon Signed-Rank Test
- 13–5 The Kruskal-Wallis Test
- 13–6 The Spearman Rank Correlation Coefficient and the Runs Test
- Rank Correlation Coefficient
- The Runs Test
- Summary
- CHAPTER 14: Sampling and Simulation
- Introduction
- 14–1 Common Sampling Techniques
- Random Sampling
- Systematic Sampling
- Stratified Sampling
- Cluster Sampling
- Other Types of Sampling Techniques
- 14–2 Surveys and Questionnaire Design
- 14–3 Simulation Techniques and the Monte Carlo Method
- The Monte Carlo Method
- Summary
- APPENDICES
- A Tables
- B Data Bank
- C Glossary
- D Selected Answers
- Index


